Geotechnical Engineering
Proctor Curve Calculator
Convert wet-density test points to dry density, plot the moisture-density relationship, and estimate optimum moisture content and maximum dry density.
Engineering schematic
Moisture–density relationship
Static symbolic figure. Enter project values in the calculator fields below.
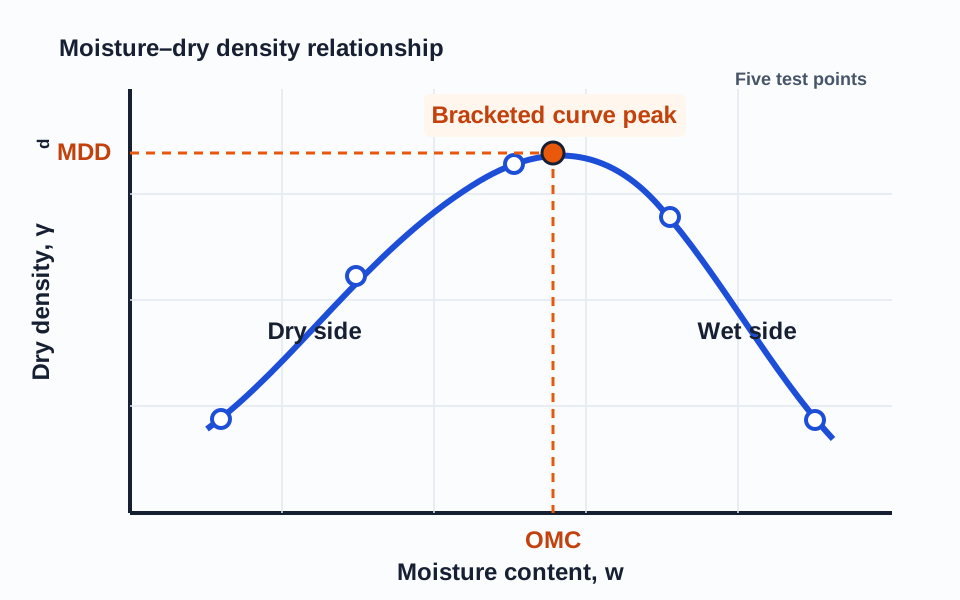
- w
- moisture content
- γd
- dry density
- OMC
- optimum moisture content at the bracketed peak
- MDD
- maximum dry density at the bracketed peak
Result
Estimated OMC 10.43%; MDD 117.16 pcf
Estimated optimum moisture
10.43%
Estimated maximum dry density
117.16 pcf
Measured maximum point
117 pcf at 10%
Points evaluated
5
Peak method
Three-point parabolic fit
Step-by-step calculation
- Point 1 dry density
- Point 2 dry density
- Point 3 dry density
- Point 4 dry density
- Point 5 dry density
What this means
The calculated dry-density points define the entered moisture-density relationship. Confirm that the tested moisture range brackets a clear peak and review the curve shape, soil description, oversize fraction, and applicable standard before reporting OMC or MDD.
Important limitations
- The fitted peak is a screening estimate. Determine reportable OMC and MDD using the governing test standard and laboratory judgment.
Assumptions
- Entered densities are wet bulk densities measured for each compaction point
- All points represent the same prepared soil and compactive effort
- No oversize-particle correction is included
Formula Used
Step-by-Step Example
Five moisture-density points that bracket the peak can be converted to dry density and fitted locally to estimate the curve's OMC and MDD.
Engineering Notes
- Enter wet bulk density and moisture content for each point; the calculator performs the dry-density conversion.
- A reportable curve should bracket a clear peak with points on both the dry and wet sides.
- The local parabolic estimate is an arithmetic check, not a substitute for the governing laboratory test procedure and curve review.
FAQ
Does the fitted peak replace the laboratory result?
No. It is a transparent screening estimate. Reportable OMC and MDD must follow the governing test standard, curve review, and laboratory procedures.
Why must the curve peak be bracketed?
If the highest dry-density point is at the end of the tested moisture range, the true optimum may lie beyond the entered points.
Should wet density or dry density be entered?
Enter wet bulk density and moisture content for each point. The calculator converts each point to dry density.