civil engineering
How to Read a Proctor Curve: OMC, MDD, and Example
Read a Proctor moisture-density curve, identify OMC and MDD, check dry and wet sides, verify peak bracketing, and follow a worked dataset.
Start With the Axes
A Proctor curve plots moisture content on the horizontal axis and dry density on the vertical axis. Each plotted point comes from a compacted specimen with measured wet density and moisture content. Dry density is calculated before plotting.
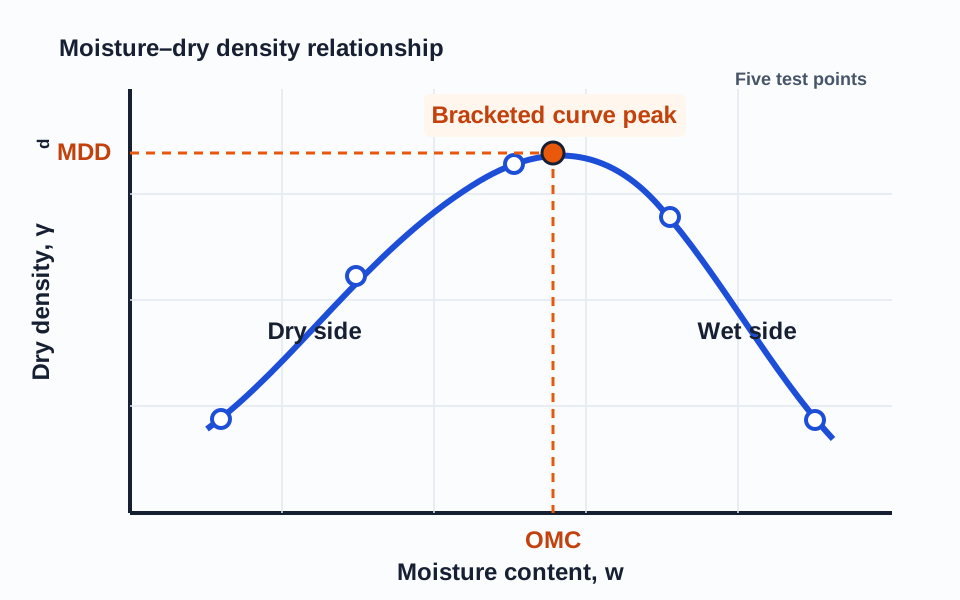
The curve should rise from the dry side, reach a peak, and then decline on the wet side. The interpreted peak is MDD, and the moisture content at that peak is OMC.
Dry Side of Optimum
On the dry side, there is not enough water to help particles rearrange efficiently under the applied effort. Fine-grained soil can be stiff and cloddy. Field lifts may show poor mixing, weak bonding, high air voids, and variable test results.
Adding controlled water and mixing it through the lift can improve compactability. Spraying only the surface does not establish uniform conditioning.
Near Optimum Moisture
Near OMC, the tested soil reaches its highest dry density under the specified laboratory effort. This does not mean OMC is always the required placement moisture. Specifications may establish a range dry or wet of optimum based on strength, permeability, shrink-swell behavior, and construction objectives.
Wet Side of Optimum
On the wet side, additional water occupies void space and dry density falls. Fine-grained soil may become soft, pump under equipment, rut, weave, or squeeze laterally. More roller passes may not solve a moisture-controlled problem.
Wet-side compaction can produce a different soil fabric than dry-side compaction at the same dry density. That fabric can affect permeability, compressibility, and strength.
Is the Peak Properly Bracketed?
A reliable interpretation needs points on both sides of the peak. If the highest dry-density point is the first or last point tested, the moisture range may not bracket the true optimum. Additional test points are usually needed.
A computer-generated smooth curve cannot repair an unbracketed test. Curve fitting should support engineering interpretation, not create a peak outside credible data.
Check the Curve Shape
- A smooth single peak is the expected general pattern for many soils.
- A broad flat peak means small moisture changes may produce little density change, but field behavior can still vary.
- Scatter can indicate inconsistent mixing, sample variation, moisture error, mass or volume error, or procedural problems.
- Two apparent peaks may reflect gap grading, particle breakage, soil blending, or poor data rather than two valid optima.
- A nearly straight rising or falling trend often means the tested range missed the peak.
Zero-Air-Voids Check
The zero-air-voids line represents theoretical saturation for an assumed specific gravity. Compaction points should remain below it. A point above the line is physically inconsistent with the assumptions and should trigger a review of moisture content, density, mold volume, specific gravity, and units.
The line is a quality-control reference, not a target that field compaction should reach.
Example Interpretation
Suppose dry densities are 105, 112, 117, 115, and 110 pcf at 6, 8, 10, 12, and 14 percent moisture. The peak is bracketed because density rises to 10 percent and declines at 12 and 14 percent.
| Test point | Moisture content | Dry density | Position on curve |
|---|---|---|---|
| 1 | 6% | 105 pcf | Dry side |
| 2 | 8% | 112 pcf | Dry side |
| 3 | 10% | 117 pcf | Near the measured peak |
| 4 | 12% | 115 pcf | Wet side |
| 5 | 14% | 110 pcf | Wet side |
A fitted curve may estimate OMC slightly above 10 percent and MDD slightly above 117 pcf. The reported precision should reflect test quality and laboratory practice.
Connecting the Curve to Field Tests
Plotting a field result relative to the laboratory curve can help explain behavior. A result far dry of optimum may need moisture conditioning. A result wet of optimum may meet density but remain unstable. The acceptance decision must follow the specification, not a visual impression alone.
Common Mistakes
- Reading wet density as dry density.
- Selecting the highest point without evaluating whether the peak is bracketed.
- Using an overly flexible curve that passes exactly through noisy points.
- Assuming the laboratory curve represents every soil placed on the project.
- Treating OMC as a permanent in-service moisture content.
- Ignoring the difference between Standard and Modified effort.
Frequently Asked Questions
Why is the Proctor curve sometimes flat?
Some granular or broadly graded soils show less moisture sensitivity in the tested range. Verify that the method is suitable and that a defensible peak was obtained.
Should field points plot on the laboratory curve?
Not necessarily. Field equipment applies different stress paths and energy. The laboratory curve is a reference for MDD and OMC, not a prediction that every field point follows the same path.
Can software determine OMC automatically?
Software can calculate and fit data, but the laboratory must still review curve shape, bracketing, soil variability, test procedure, and significant figures.
Related calculators
Related articles and resources
References
- Das, B. M. Principles of Foundation Engineering.
- FHWA geotechnical engineering circulars and technical references.
- ASTM and AASHTO standards where applicable.